Design Any Product, Part 4: Low Fidelity Designs (Sketch First, Polish Later)
- Leor Wolins

- 22 hours ago
- 7 min read
Welcome back to Part 4 of the Design Any Product series. If Part 3 was about turning research into direction, Part 4 is where that direction becomes something you can hold. Low fidelity is the phase where abstract ideas finally become visible.

Ugly drawings beat polished prototypes here. Every single time.
This is the phase where speed and crappiness are features, not bugs. You are not trying to ship something beautiful yet. You are trying to figure out whether the idea even works. Done well, low fidelity is the cheapest, fastest way to catch a bad idea before it costs you a sprint. Done badly, you skip this phase and build a beautiful version of the wrong thing.
3 low-fidelity tools do most of the work in this phase.
Sketching Quick, ugly drawings that let you explore many ideas in an hour.
Creating Wireframes Structured layouts that show the bones of the interface without the visual polish.
Design Presentation The conversation where wireframes meet stakeholders and survive contact with reality.

Three ways to think on paper.
Three ways to validate before you invest.
One shared goal: get to clarity before you get to polish.
Let's break each one down.

Sketching
Sketching is the first time an idea leaves your head and lands somewhere your team can react to. The whole point is speed. You should be embarrassed by how rough these look. If you are not, you are spending too much time on each one.
7 steps shape this work.
The step | What it produces |
Define objectives | A clear purpose and scope for the sketching session |
Set the stage | The right people, materials, and environment |
Generate ideas | A wave of raw, judgment-free concepts |
Apply techniques | Thumbnails, rapid iterations, visual metaphors |
Collaborate | Group feedback that sharpens the best ideas |
Select and refine | The strongest concepts, polished one notch |
Document and archive | A reusable library of your team's thinking |
Define the Objectives of Sketching
Purpose
Clearly articulate why you are sketching. Typically, this includes visualizing design ideas, exploring different concepts, and facilitating communication within the team.
Scope
Determine the scope of the sketching session, focusing on specific design problems, features, or interactions.

Set the Stage
Brainstorming Session
Schedule a brainstorming session with the design team to generate ideas and solutions.
Materials
Gather sketching materials such as paper, pencils, markers, whiteboards, or digital sketching tools.
Environment
Choose a comfortable and conducive environment for sketching, whether it is a meeting room, a collaborative workspace, or a virtual meeting platform.
Generate Ideas
Divergent Thinking
Encourage participants to generate as many ideas as possible without judgment. Quantity is prioritized over quality at this stage.
Silent Sketching
Allow individuals to sketch silently for a set period, typically 5 to 10 minutes, to explore their ideas without distraction.
Variety of Perspectives
Encourage participants to approach the problem from different perspectives and angles. Diversity in ideas leads to more creative solutions.

Sketching Techniques
Thumbnail Sketches
Start with small, thumbnail sketches to quickly explore different concepts and variations.
Rapid Iteration
Iterate rapidly on initial sketches, refining and evolving ideas based on feedback and insights.
Visual Metaphors
Use visual metaphors and symbols to convey ideas and concepts in a concise and impactful way.
Annotation
Label sketches with brief annotations or notes to provide context and explain design decisions.
Collaboration and Feedback
Share and Discuss
Have participants share their sketches with the group and explain their ideas. Encourage open discussion and feedback.
Build on Ideas
Use the "Yes, and..." principle to build on each other's ideas and foster a collaborative atmosphere.
Critique Constructively
Provide constructive feedback on sketches, focusing on strengths, areas for improvement, and potential next steps.

Select and Refine
Voting or Dot-mocracy
Use a voting or dot-mocracy technique to prioritize and select the most promising ideas.
Combine and Synthesize
Look for common themes and patterns in the selected sketches. Consider combining elements from multiple sketches to create hybrid solutions.
Refinement
Refine selected sketches further, adding detail and clarity to communicate the intended design concept.
Document and Archive
Capture Ideas
Document sketches digitally or photograph physical sketches to preserve ideas for future reference.
Organize and Archive
Create a repository or archive of sketches organized by project or theme. This serves as a valuable resource for future projects and design iterations.

Creating Wireframes
Wireframes are where the sketch grows up. The hand-drawn squiggle becomes a structured layout that shows the bones of the interface. Still no visual polish. Still no real content. Just the structural truth: where things go, how they connect, what comes first.
7 steps shape this work.
The step | What it produces |
Define objectives | Scope and purpose for the wireframes |
Gather requirements | Research, personas, and stories grounding the work |
Identify elements | Content hierarchy and the core layout |
Choose your tool | Digital or analog, whatever moves you fastest |
Create wireframes | Low-fidelity, iterative, responsive layouts |
Annotate and document | Context and rationale for stakeholders |
Review and iterate | Feedback woven in, weaknesses addressed |

Define the Objectives of Wireframing
Purpose
Clearly articulate why you are creating wireframes. Typically, this includes visualizing the basic structure of a page or interface, defining layout and content hierarchy, and aligning stakeholders around the design direction.
Scope
Determine the scope of the wireframes, focusing on specific pages, screens, or user flows within your product.
Gather Requirements and Research
Requirements Analysis
Review project requirements, user stories, and design briefs to understand the goals and constraints of the project.
User Research
Incorporate insights from user research, personas, and user stories to inform the design of wireframes.

Identify Key Elements and Layout
Content Hierarchy
Determine the most important content and functionality that needs to be included in the wireframes. Prioritize elements based on user needs and business goals.
Layout Design
Define the overall layout and structure of the page or interface. Consider factors such as navigation, content placement, and call-to-action placement.
Choose a Wireframing Tool
Digital Tools
Select a wireframing tool that best suits your needs and preferences. Popular options include Sketch, Adobe XD, Figma, Balsamiq, and Axure RP.
Analog Tools
Alternatively, you can create wireframes by hand using pen and paper or on a whiteboard.

Create Wireframes
Start Simple
Begin with low-fidelity wireframes that focus on basic layout and content placement. Use simple shapes and placeholder text to represent elements.
Iterative Process
Iterate on wireframes based on feedback from stakeholders, usability testing, and design iterations. Gradually add detail and refine the layout as needed.
Responsive Design
Consider how the layout will adapt to different screen sizes and devices. Design wireframes with responsiveness in mind to ensure a consistent user experience across platforms.
Annotate and Document
Annotations
Include annotations or notes to provide additional context and explain the purpose of each element in the wireframe.
Documentation
Document design decisions, rationale, and any relevant information that will help stakeholders understand the wireframes.

Review and Iterate
Stakeholder Feedback
Share wireframes with stakeholders for review and feedback. Incorporate their input to refine and improve the wireframes.
Usability Testing
Conduct usability testing with wireframes to gather feedback from real users. Use insights from testing to iterate on the design.

Design Presentation
This is where the work survives contact with the room. A design presentation is the conversation that turns your wireframes into shared understanding across business, product, engineering, and data. Done well, it earns you the green light. Done badly, you walk out of the room with a redesign request that could have been avoided.
4 phases shape this work.
The phase | What it produces |
Preparation | Clear purpose, content, and audience read |
Structuring the presentation | A logical flow from research to next steps |
Delivery | Format, engagement, and adaptive presence in the room |
Follow-up | Documented feedback and ongoing communication |

Preparation
Objective
Ensure clarity on the purpose of the presentation, whether it is for feedback, approval, alignment, or updates.
Content Collection
Gather all necessary materials, including user research data, personas, wireframes, prototypes, high-fidelity designs, and any relevant documentation.
Audience Analysis
Understand the expectations and expertise of the audience (business, product, engineering, and data science teams) to tailor the presentation accordingly.

Structuring the Presentation
Introduction
Welcome and introductions, plus a concise project overview covering goals, scope, and significance.
User Research and Insights
Share key findings from user research, highlighting user behaviors, needs, and pain points. Introduce user personas developed based on research to illustrate target audience segments.
Value Proposition Mapping
Explain the value propositions of the product, addressing what it is, who will use it, and why. Show how the value propositions meet both user needs and business objectives.
Concept Sketching and Ideation
Present initial sketches and design concepts that were explored. Describe the brainstorming and ideation techniques used to develop these concepts.
Wireframing and Prototyping
Display wireframes that outline the basic structure and layout of the product. Share interactive prototypes that simulate the user experience, explaining key interactions and user flows.
High-Fidelity Design
Showcase high-fidelity mockups, emphasizing visual design elements, branding, and style guide components. Provide a comprehensive view of the final design, including detailed visual and interactive elements.

Technical Implementation
Discuss technical constraints and requirements to ensure the design is feasible within the given technical framework. Highlight ongoing collaboration between design and engineering teams to address any implementation challenges.
Data Science Integration
Explain how data science insights have influenced the design process. Describe any data-driven features or optimizations included in the design.
Next Steps and Timeline
Outline the next steps in the project, including key milestones and deliverables. Provide an estimated timeline for the remaining phases.
Q&A and Discussion
Invite questions, feedback, and discussion from all attendees to ensure clarity and address any concerns.
Delivery Format
Decide whether to present in person, virtually, or through a recorded presentation, depending on what works best for the team.
Engagement
Actively engage the audience by asking for input, encouraging questions, and fostering an interactive dialogue.
Adaptation
Be prepared to adapt your presentation based on the audience's responses and feedback during the session.

Follow-Up
Feedback Documentation
Record any feedback received and plan for follow-up actions to address it.
Resource Sharing
Provide additional resources, such as detailed documentation or access to prototypes, to help stakeholders understand and collaborate.
Ongoing Communication
Maintain regular communication with all teams to keep them updated on progress and incorporate their feedback into subsequent iterations.

Putting it all Together
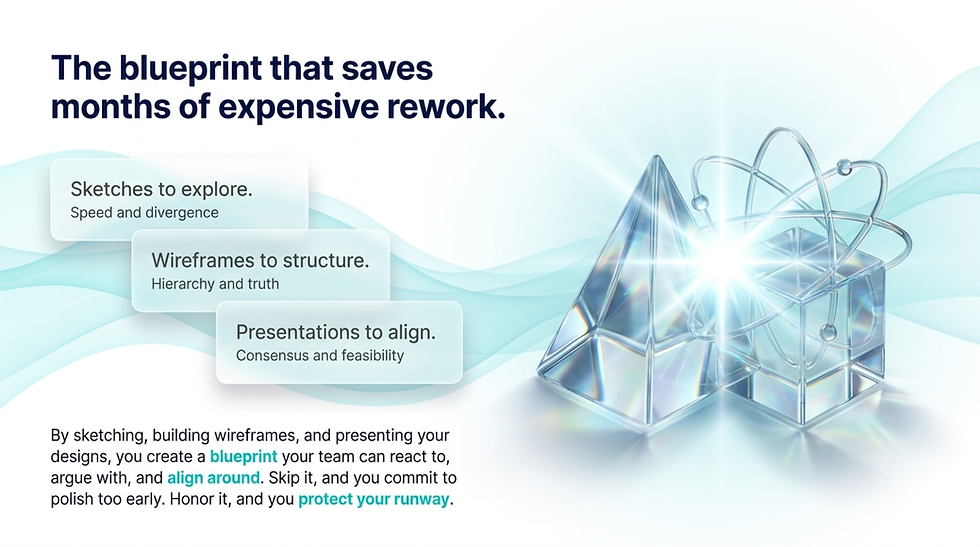
Low-fidelity design is the cheapest, fastest way to find out whether your idea actually works before you spend a sprint making it beautiful. By sketching, building wireframes, and presenting your designs, you create a blueprint your team can react to, argue with, and align around. This phase is built for speed, iteration, and feedback. Skip it and you commit to polish too early. Honor it and you save your team months of expensive rework.
Sketches to explore.
Wireframes to structure.
Presentations to align. That's the low-fidelity phase.
With the structure of your product in place, it is time to take it to the next level. The framework is laid. The conversations are settled. Now we add the polish.
Up next, Part 5: where the sketches become the real thing. High-fidelity time.

Read The Full Series
This is Part 4 of 5.
Part 1 | |
Part 2 | Research |
Part 3 | Analysis |
Part 4 | Low Fidelity Designs |
Part 5 | High Fidelity Designs |


Comments